

UAV survey is the third eye of the vineyard manager. Is not just a phrase to incite you to try this technology but it is a fact. just think that every day you want to observe the vineyard from the edge of the field or within it, but you never have a general overview from above of its state. And as you well know, having an overall view of the vineyard is crucial to be able to apply agronomic management aimed at increasing the quantity and quality of the grapes and of the wine.
However, in order to achieve this goal, we have to perform artful data acquisition, processing and interpretation. In this article we are going to show you what all the processing steps and suggestions we can then suggest for precision agronomic vineyard management
Drone UAV survey for a better vineyard management
Let's explore how and why a drone UAV survey can help a vineyard manager to apply a better agronomic management.
The UAV survey can allow:
Better fertilization management, indeed we can detect a portion of the field that has low vigor, and so we can provide higher amount of mineral or organic fertilization
Better pruning management, indeed we can detect a portion of the field that has high vigor, and so we can set a different pruning management strategy in order to reestablish the right productive vegetative balance.
Better irrigation management, We can monitor the leaf temperature from above, and this is the best indicator for the water stress status of the vineyard, and so allow us to define when apply irrigation and in which field and in which portion of the field
Better pesticide management, when we observe a circular spot of high leaf temperature in a vineyard whose temperature is moderate on average, this is an indicator of an ongoing pathology which by altering cellular content results in a rise in temperature.
Choose the right rootstock, Using remote sensing data, we can observe spatial variability in the soil, which will forever impact the production and quality level of our vineyard. But we can reduce or eliminate this by knowing the variability in the soil and choosing the correct rootstock
Counting the number of missing plant or vine failure, using the drone we can easily count the number of failures in a vineyard, identifying the number of missing plants for each variety, so you can purchase the correct number of rooted cuttings in addition to knowing how much wine you are missing each year
As you can see, we have described 6 different ways in which agronomic practices can be made efficient in a vineyard, and all six require just one drone survey. But all of these different activities need a survey done properly and also to a data processing done to achieve each of these essential points, to extract the most from each of each survey.
Everyone can survey but not everyone does proper processing
Nowadays carrying out a survey with a drone is increasingly easier given the presence of commercial drones with integrated multispectral and thermal cameras and RTK modules. But the survey alone is not enough to make agronomic choices more efficient, accurate data processing is needed.
A carefully data processing operations in vineyard context is very important cause:
We need to create a good orthomosaic starting from the raw data, and to do so we need to know how to use software like Metashape and PIX4D or DJI Terra
We need to crop the data only inside the vineyard and therefore remove the data acquired nearby during a drone survey
We need to remove the inter-row, which can be worked and/or sown naturally or artificially. Removing the inter-row data not only gives a greater focus on the row where the plants are, but also allows for a more objective interpretation of the data. So the segmentation step is crucial for vineyard, fruticulture and horticulture crops.
Calculating vegetation indices is not a trivial task and must be chosen based on the current phenological stage. Based on the crop phenology stage we need to calculate different vegetation indexes.
Furthermore, specific processes must be carried out in order to generate detailed prescription maps or to perform failure counting.
Here below we will describe a case study that we have done in order to provide a really good survey and elaboration service, and allow you to compare our elaboration with others elaboration.
Case Studies
Between 2018-2024 we have monitored over 100 ha of vineyard, mostly in center of italy in very prestigious wineries like Castello di Solomeo, Giodo, Petra, San Felice, Trinoro. In one of each one we have made different elaboration cause the aim of the UAV survey was different. To do so we are collaborating with Simonit & Sirch and the Agronomist Simone Mariotti
Better fertilization management
The optimization of the fertilizer is the most common and famous precision farming application, which could be applied with mineral or organic fertilization. To do so we have to divide the field in homogenous zones. The homogenous zones are zones where we define the behavior of plants within it is similar, while plants have different behavior between different zones. Based on this we can then define the amount of fertilizer to apply to different zones. Here below the procedure that we apply to generate the high quality prescription map.

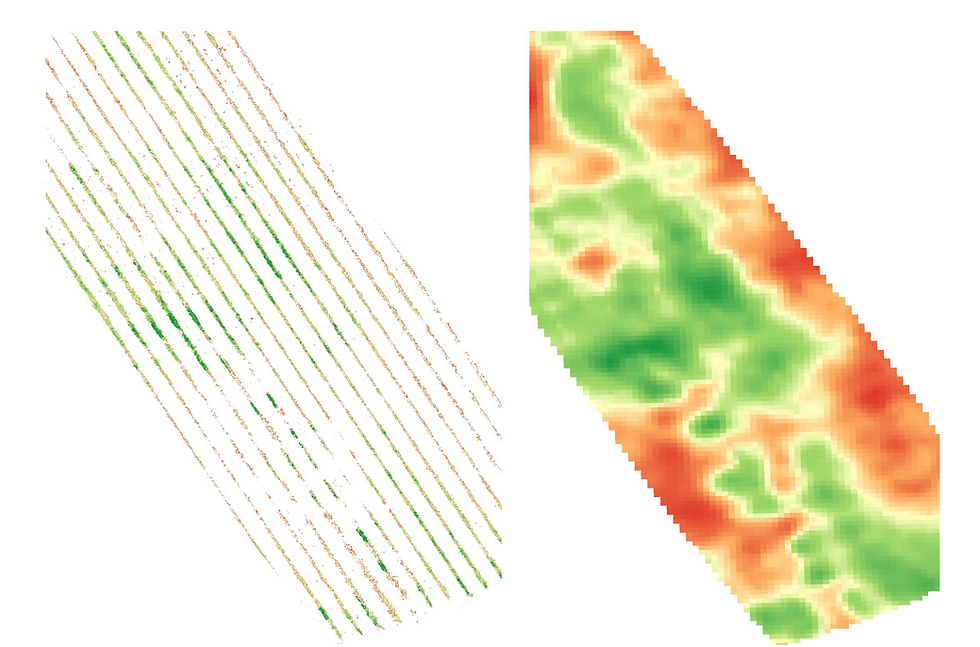
As you see three steps are required:
Calculate the vegetation index
Then remove the inter-rows data based on AI Segmentation Model that we have created after years of data acquisition
Prescription Map Generation.
After this we have to set the type, amount of fertilizer to apply and then set the timeline to provide the entire amount of fertilizer. In this case, if you want to precise calculate the right amount of fertilizer, it is suggested to use the nitrogen balance equation.
Better irrigation management
At the same site where we surveyed with the multispectral drone, we also conducted a survey with a thermal camera, which allows us to detect water stress.
The identification of water stress is very simple:
When the leaf temperature is higher than the air temperature, it indicates that the plant no longer performs gaseous exchange with the outside due to the closure of stomata that the plant puts in place during water stress.
When the leaf temperature is less than the air temperature, it indicates that the plant is doing gaseous exchange with the outside because the stomata are open.
In addition, there is the Crop Water Stress Index, which makes it easy to identify whether water stress is occurring. The Crop Water Stress Index is an index calculated from the thermal values.

Better pruning management
Based on remote sensing data and ground data it could be possible to create also a prescription map for precise pruning management.
In order to apply this we have to measure:
Georeferenced ground data related to Number of Shoots, Number of Leaves, LAI, Number of Clusters, and Cluster Weight
Remote sensing data
Thanks to these data we can set up a precise pruning management for each vineyard field zone.

Better pesticide management
By performing a thermal UAV survey we can detect if there is ongoing stress related to pathological infections. When a thermal image report a spotted circle of high temperature as reported in the image below it is certain that there is a pathological stress in place and such must be attended to by the vineyard manager who must make a survey in order to understand the nature of such infection.

Choose the right rootstock
We don't need to explain to you, why the choice of rootstock is critical but we can tell you that the evaluation of the soil spatial variability should be taken into account while choosing the right rootstock.
Here below we will show a map of a vineyard during the 2025.

As you can see, on the top-right and top left of the vineyard the soil and related vegetation is different than the bottom of the vineyard.
This could have been solved if at the time of variety and rootstock selection the spatial variability observable by satellite was considered, in fact in the second image we show satellite images before vineyard planting (2011) which clearly shows the difference in the two soils.

Counting the number of missing plant
On average, it is estimated that for each hectare planted, plant failure values of up to 15 percent can be achieved. This plant loss then translates into an annual loss of grape and wine production. In the context of quality wines this can be worth as much as hundreds of thousands of euros in lost revenue each year.
Therefore, identification of the fallacies, their number and their relative variety is critical in order to purchase the correct number of rooted cuttings for planting.
A drone survey in addition to all the benefits we told you about above allows you to count the number of failures and also determine their location.
Here below is a small abstract of work done to identify the location of failures using artificial intelligence algorithms.

In this particolar case we have counted over 2000 failure plants over 23 ha... a lot work to do.
No doubt it is usefull
So when do you want to embrace this techology and perform an UAV survey?
Comments